
 English
 Svenska
Categories
Viewing your site analytics
Track visitors, visits, and pageviews with the built in analytics in the Website Builder.
On this page
Once you have set up your website, it is time to grow your audience. Let’s see what you can achieve with your built in Analytics page.
Accessing your site analytics
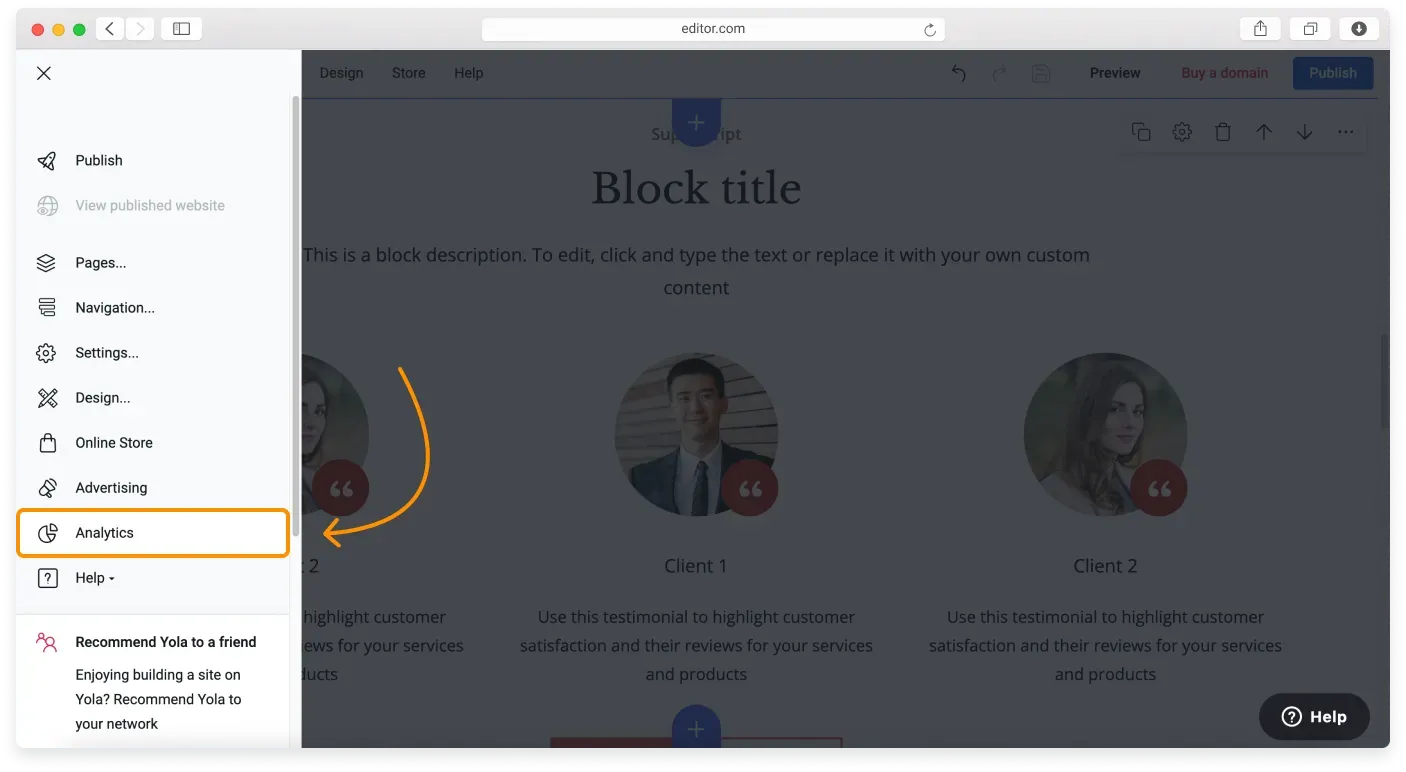
Click the Main menu button in the top left corner of the Website Builder and find Analytics in the Sidebar. Click it to open Analytics.
Upgrade may be needed
You may need to upgrade your plan to view this page.
Navigating the Analytics page
The Website Builder lets you track and measure various categories shown on the Analytics page.
At the top of the Analytics page you see the dashboard with the basic performance data: your website visitors, the percentage of new ones among them, visits, and pageviews. This screen also has a date range selector with preset ranges and a Custom Range option.
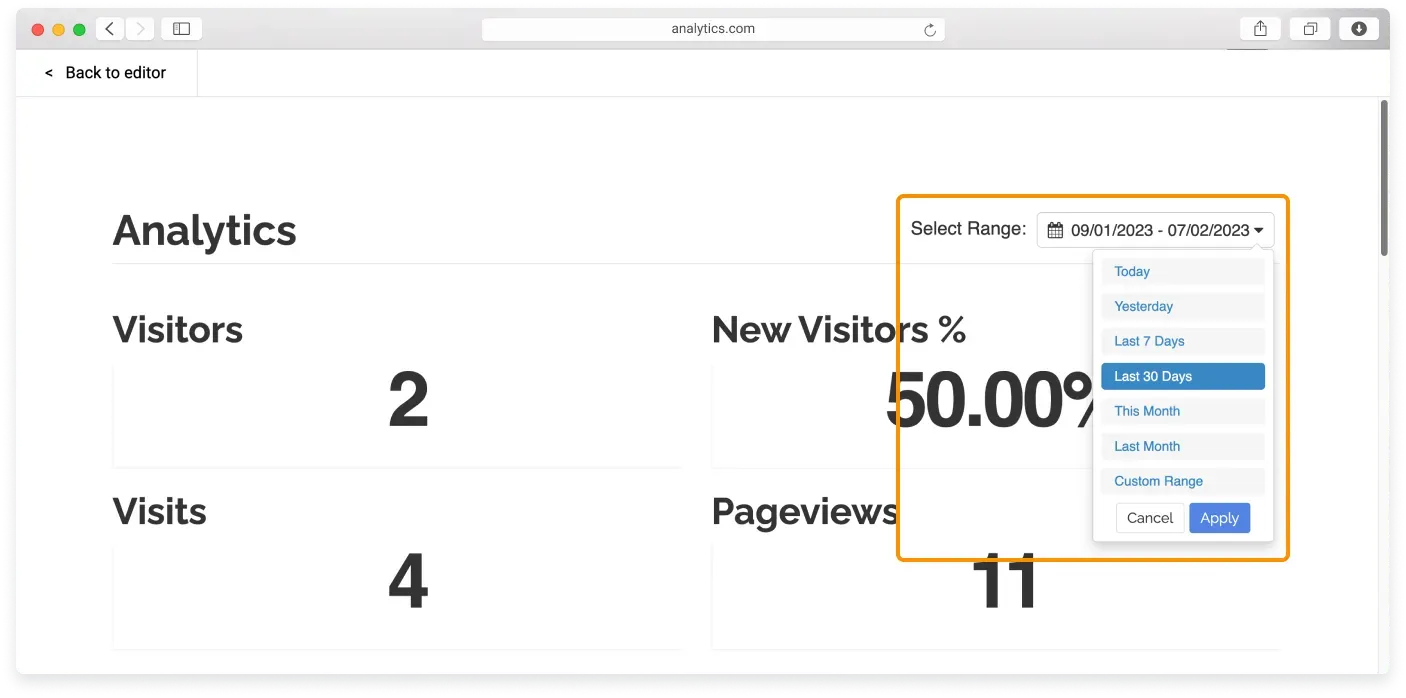
By scrolling down the page, you reach the data in detail. Hover over the icons near the charts to show tooltips with an explanation.
Here are the metrics in detail:
- Visits: The number of individual sessions started by all the visitors to your site. If a user is inactive on your site for 30 minutes or more, any future activity is attributed to a new session. Users who leave your site and return within 30 minutes are counted as part of the original session.
- Visitors: The different visitors your site gets, identified by their IP address. One visitor can have multiple visits to your site. Analytics also identifies several types of visitors that help you better manage your traffic building methods: Researchers, Repeats, Prospects, and Fans.
- New visitors: The brand new visitors to your site. This can also be the same person visiting from a different location, and therefore a different IP address.
- Pageviews: An instance of a page being loaded by a browser. The Pageviews metric is the total number of pages viewed, and repeated views of a single page are also counted.
- Landing pages: Here you can see which pages people use most often to enter your site, and target new areas for improvement.
- Origin: This area shows the websites your visitors came from. If they simply typed your URL in the browser, they appear as Direct.
- Engagement: Any user interaction with your site. The engagement index is a combination of user activity, such as the number of pages viewed, the time visitors spend on the site, and whether they completed any goals (signing up, filling out a contact form, or making an order). Higher levels of engagement indicate that visitors are interacting with the site in a positive way.
Statistics are delayed
When you open Analytics, you do not see real time results. Site statistics are delayed by 2 hours. Campaign statistics are delayed by 24 hours.
Related articles
- Customizing your page SEO settingsAdd a search friendly title, description, and keywords to each page of your Website Builder site.
- Using metadata to improve your SEOUnderstand how title tags, meta descriptions, and keywords help search engines rank your pages.
- Adding Google Analytics 4 to your websiteConnect Google Analytics 4 to your Website Builder site to track traffic for free.
Can’t find what you need?
Contact our team. We’re here 24/7 by email and ticket.